A Precise and Customizable Planisphere
This project generates a precise, customizable planisphere as two PDF files (a star chart and a transparency).
The two files are then printed on a high-resolution printer, and the results are attached together in the center with a rivet.
One file is meant for printing on card stock, and the other as a transparency.
The transparency rotates around a central rivet or pin.
The source code is here.
The planisphere uses the stereographic projection, which is appropriate only for latitudes outside the tropics.
(That is the main defect of this projection.)
The output is configured using a
config.ini text file.
A number of minor settings, which most people would not want to change, are hard-coded.
How To Make The Planisphere
If you are unfamiliar with compiling and running Java programs, I suggest you:
- install the Eclipse IDE For Java Developers (about 343 MB) using the Eclipse Installer.
(Note the important details in the installer's Find out more link.)
- you can use youtube videos to guide you, if you wish
- create a workspace directory (a place to hold multiple Java projects)
- put the source code for this project in a directory underneath the workspace directory (example below)
- open Eclipse, and point it to your workspace directory
- navigate to
planisphere.Build, right click on it, and Run As -> Java Application
- review the generated log files
Example directory structure:
C:\bob\workspace    (when you open Eclipse, point it to this directory!)
  planisphere       (the name of the project with the planisphere code)
    bin             (this directory gets generated when you run the code)
    docs
    lib             (contains a 'jar' file, a Java library for creating PDFs)
    src
    .classpath      (this points Eclipse to the lib\itext jar file)
    .project
Next:
- review the planisphere/config/config.ini file, and change it to suit your needs.
The width and height need to match the paper size to be used on the printer. Save the changes.
- run the
planisphere.Build class to generate two PDF files.
Print:
- print the PDF files on a high-resolution printer. You may need to use a commercial print shop for best results.
(For me, the cost is about $12.)
- print
the starchart.pdf file on card stock (thick paper). One page, double-sided.
- print the
transparency.pdf file on a transparency. One page, single-sided.
Cut, puncture, and attach:
- make the star chart square, by cutting the star chart along the indicated horizontal lines above and below the star chart.
- make the transparency circular, by cutting just outside its outermost circular border.
- puncture the transparency and the star chart at the indicated celestial pole, in the center.
Puncture them separately.
Use a sewing needle to get the holes started.
Gradually enlarge the holes with larger tools.
Be as precise as possible!
- carefully align the transparency on top of the star chart.
The outermost circles, for the date-scale and the time-scale, should line up neatly along their full border, 360 degrees.
- attach the transparency to the star chart. I've had success with a small lapel pin.
You might also choose a rivet, or something similar.
Verify the centering. Examine the intersection of the celestial equator with the horizon.
As you rotate the transparency 360 degrees, the intersection point of the celestial equator with the horizon should
always coincide with the east-west point.
Design Goals
The main design goals of this planisphere are:
- to optimize the design for experts, not beginners
- include only minimal text and markings, and only what's necessary for the correct operation of the planisphere.
- allow customization,
including for a given location and year.
- be much more precise than the typical planisphere.
The main source of error in the planisphere produced by this project will almost always be the
mechanical misalignment between the star chart and the transparency, not in its design.
- to predict the transit time of an object on the celestial equator to within approximately 1 minute.
- allow for time-travel into the past or future, for thousands of years.
This is possible since it uses a precession algorithm that's valid over long time scales, and by including 3D proper motion.
For years other than that for which the planisphere was generated, the precision will of course be significantly reduced.
Planispheres are seldom expected to be precise.
Nevertheless, it's always interesting to push an instrument to its limits, to see how far you can go.
That said, many people will be perfectly content with planispheres having significantly lower precision.
What's Included
The planisphere's star chart includes (example PDF, with the star chart on page 2):
- stars brighter than magnitude 5.02 (derived from this open source bright star catalog)
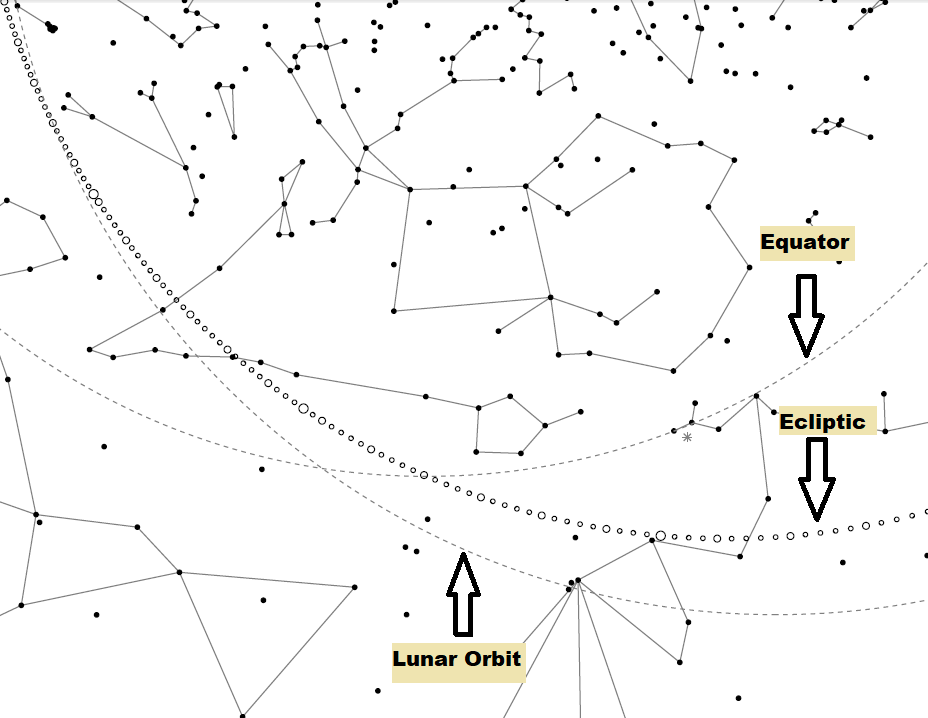
- the position of the Sun at 18h standard time for every day (using the configured time zone and year) - example
- the path of the Moon's orbit on July 1 of the configured year - example
- the celestial equator
- the radiant positions for the brightest meteor showers (configurable) - example
- the constellations as simple stick drawings, without names (to reduce clutter for those who already know the night sky)
- a date-scale to indicate the observer's sidereal time at 20h standard time each day of the year, in their own time zone
- a table on the back for the Moon, with both the fraction illuminated and its time of transit for every day of the year
- a table on the back for the bright planets, with the time of transit of the planet on the 15th of every month.
The tables for the Moon and bright planets are used to get approximate positions for those objects over the course of the configured year.
The planisphere's transparency goes on top of the star chart.
The transparency includes (example PDF):
- a time-scale with divisions for every 2 minutes (or 1 minute, if you choose)
- markings for every degree of altitude on the meridian, and every degree of azimuth on the horizon
- circles for every 10 degrees of altitude and azimuth
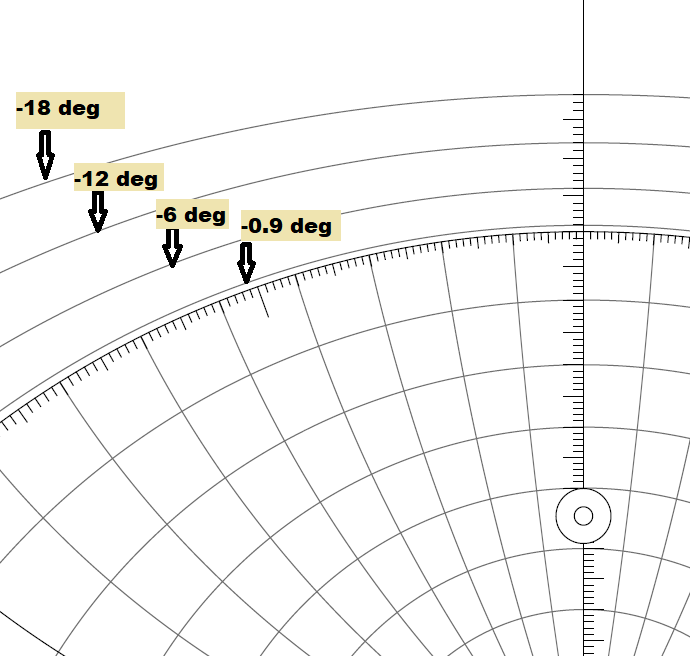
- circles for the altitudes below the horizon to indicate civil, nautical, and astronomical twilight - example
- a special circle at 0.9 degrees below the horizon, for computing the time of sunset and sunrise
Higher Precision
An effort has been made to make the planisphere as precise as possible:
- the star catalog has precession applied to the configured year.
The effect of precession is detectable on a small-scale star chart, even after only 20 years.
- the date-scale is generated specific to a given lat/long, offset from UT, and year.
The date-scale uses the local sidereal time at 20h standard time every day. This increases precision.
- a correction is applied for the difference in longitude between the observer and the central meridian of their time zone.
This allows the time-scale to be in Standard Time (UT plus/minus an offset), not Local Mean Time.
- the time-scale shows mean solar time (to match your clock), not sidereal time. The sidereal day is
shorter than the mean solar day, by about 3m 56s. This means that the time-scale shows slightly less than 24 hours.
- by default, the time scale has divisions for every 2 minutes. This renders well with an 8 inch version. For a larger
version, you may want to change that to every minute.
- for predicting sunrise and sunset, a special altitude of -0.9 degrees has been added, just below 0.0 degrees.
This accounts for refraction at the horizon, the Sun's mean semi-diameter, and for the observer being
about 2 meters above the real horizon. (See the Explanatory Supplement to the Ephemeris, 1961, page 401).
Sunrise and sunset correspond to the center of the Sun's disk being at that altitude.
For the stars, the rise/set altitude is near -0.57 degrees, not -0.9.
For the Moon, the rise/set altitude is in the range of +0.08 to +0.18 degrees, because of its large horizontal parallax.
Discontinuities
There are two small discontinuities in the planisphere (by design), which bear witness to the astronomical reality:
- the date-scale usually shows a small discontinuity between Dec 31 and Jan 1.
This is because the date-scale is specific to a given year.
It shows the observer's sidereal time at 20h in their configured time zone.
- the time-scale on the transparency has a discontinuity, which I decided to place near 08h.
This is because the solar day and the sidereal day aren't the same length.
Implementation
Notes about the implementation:
- all text files, and all .java files, use the UTF-8 encoding; your dev environment must also treat them as UTF-8
- the author has run this code only on Windows OS, not on Linux
- vector graphics are used (not raster graphics)
- the fonts are embedded in the PDF
- different printers may render thin lines differently
- the logging can be made silent simply by changing one setting in the
LogUtil class
Tools Used
Items used in building this tool:
- stars: the star catalog is taken from this project of mine, intended as a replacement
for the Yale Bright Star Catalog.
- planets: the VSOP87D data for the planets, by Bretagnon and Francou.
- Moon: the abridged form of ELP 2000-82 as published in Astronomical Algorithms, by Meeus 1991.
- precession: algorithm and tables for P/Q, X/Y, and p/epsilon from
this paper by Vondrák, Capitaine, and Wallace.
- Astronomical Algorithms by Jean Meeus, 1991
- Explanatory Supplement to the Astronomical Ephemeris, 1961
- an old version of the iText java library (5.5.13)
What I Learned
Things I learned while building this tool:
- implementations of calculating a Julian Date from a calendar date are usually mediocre (NOVAS, SOFA).
Many implementations unnecessarily restrict the input range.
Many implementations are deeply cryptic. (For this reason, I implemented my own algorithm.
See JulianCal and
GregorianCal.)
- calculating 3D proper motions is not difficult (see Kaplan et al 1989, section IV, page 1203).
- many tools, including those produced to implement IAU standards, are optimized to produce accurate results only within a few hundred years
of J2000, and are unsuitable for use outside that range, without careful scrutiny.
- calculating precession over millenial time scales has only really been possible since the publication of
this paper by Vondrák, Capitaine, and Wallace, in 2011.
- in precession, both poles move: the equator pole and the ecliptic pole. Most people neglect the motion of the latter.
- some nearby bright stars have relatively rapid proper motion: Proxima Centauri, Sirius, Pollux, Arcturus, Procyon, Rigil Kentaurus.
- in astronomy, a simple atan3(y, x) function, like atan2 but with the return value in the range 0..2pi, is a simple and useful addition
- the JPL's DE441 ephemeris is built to calculate over a long time scale, -13200..+17191.
- for the position of the Moon, it would have been best to use ELP 2000-85, which is built for historical calculations.
An abridged version of that theory is published in the original paper, but I don't understand the paper.
It's also available in book form, but I can't find or view the book anywhere.
- to match data across catalogs, the HD Henry Draper identifier is often useful.
- the GAIA database is poor for bright objects. Its detectors aren't designed for them. I considered using GAIA for this project, but it wasn't feasible.
- the GAIA archive is a large relational database. Their tools use a flavour of SQL to do queries.
Things I'd like to have:
- access to ELP 2000-85 for the Moon (see above).
- an expression for the inclination of the Moon's orbit, instead of a constant.
This may be in Mathematical Astronomy Morsels, by Meeus.
Explorations Over Long Time-Scales
Movement of the Poles
The motion of the poles of both the equator and the ecliptic can be robustly demonstrated with this code, since it
uses a robust algorithm for long-term precession, published in 2011.
(See the BuildPolePrecession class.)
Here are examples of the motion of the poles going back into the past 38,000 years, in steps of 200 years at a time.
Note how both poles move. The ecliptic pole is the smaller, darker arc near the center.
(Note that the above charts don't include proper motion of the stars. See below for charts that include proper motion.)
Most images meant to demonstrate long-term precession are mediocre for two reasons: they show a closed loop,
and they neglect altogether the motion of the ecliptic pole.
Year of Closest Approach to the Equatorial Pole
These are the raw results rounded to the nearest arcminute, using data from Hipparcos-2 astrometry, with full 3D kinematics for proper motion.
The error bars in the underlying data are not used in these calculations.
See the underlying paper (Figure 11)
for estimates of the accuracy of the precession algorithm over long time scales.
This data was generated using the ClosestApproachToPole class.
For the years -100,000..+100,000 in the northern sky:
 Star  Year   Separation
-----------------------------------
α Lyr +89851  0°18' Vega
α Cyg -40834  2°52' Deneb
α UMi -74968  0°00' Polaris
β UMi -27240  2°09' Kochab
α Cep +58105  0°05' Alderamin
λ Cep -44141  0°15'
α Dra - 2796  0°06' Thuban
τ Her - 7607  0°32'
On the time-scale of +/-100,000 years, the error of the precession algorithm is about 300 arcseconds (5 arcminutes).
For the years -100,000..+100,000 in the southern sky:
  Star  Year   Separation
-------------------------------------
α  Dor -32064  4°05'
γ  Dor -31862  0°40'
α  Eri +73449  3°50' Achernar
γ  Cha -22453  0°12'
α  Car +91325  5°25' Canopus
ω  Car -71400  0°06'
δ  Vel + 9245  0°10' Alsephina
γ2 Vel +36629  0°08' Regor
σ  Pup -14093  0°23'
For the years -15,000..+15,000 in the northern sky:
 Star  Year   Separation
-----------------------------------
α Lyr -12049  3°26' Vega      chart
α Cyg +10202  7°27' Deneb     chart
α UMi + 2102  0°28' Polaris
β UMi - 1059  6°32' Kochab    chart
α Cep + 7539  1°55' Alderamin chart
λ Cep + 7319  4°55'
α Dra - 2796  0°06' Thuban    chart
τ Her - 7607  0°32'           chart
On the time-scale of +/-15,000 years, the error of the precession algorithm is about 50 arcseconds.
For the years -15,000..+15,000 in the southern sky:
 Star  Year    Separation
-----------------------------------
α Dor  - 6963  9°08'
γ Dor  - 6869  4°58'
α Eri  - 3360  6°59' Achernar
γ Cha  + 4125  1°32'           chart
α Car  +13844  7°27' Canopus   chart
ω Car  + 5788  0°46'           chart
δ Vel  + 9245  0°10' Alsephina chart
γ2 Vel -15000  2°33' Regor
σ Pup  -14093  0°23'           chart
Times in History
 Year   Description                Chart
----------------------------------------------
+ 150   Ptolemy of Alexandria     chart
-2796   Egypt (Thuban at pole)    chart
- 590   Thales of Miletus         chart
-8000   Neolithic revolution      north, south
Interesting: Orion isn't visible in mid-northern latitudes, in the year -8000.